We believe real assets should be included within investors’ opportunity sets given the vast investable universe available, and efficiency improvement potential in terms of risk and return that they can provide. We believe real assets should be near the top of the priority list given their potential upside from improvement in the fundamental economic outlook, relative attractiveness compared to other assets, and deep pipeline of investable strategies. However, there are many myths associated with building a real assets allocation. In this piece we will seek to dispel some of the common ones.
01
Allocating capital to unlisted strategies does not necessarily require capital to be locked up over a long-time horizon, with little to no transparency. Many unlisted strategies within real assets provide ongoing liquidity, albeit with periodic withdrawals and advance notification periods, along with transparency into the underlying strategy and holdings.

Graph depicting continuum of asset liquity:
Further, by diversifying across real assets strategies and allocating to the illiquidity risk premia, risk-adjusted returns may be improved. This is due, in part, to the valuation smoothing and volatility dampening that unlisted assets provide, along with the high-risk premia (supporting a favorable return outlook) associated with some unlisted assets.
By diversifying across real assets strategies and allocating to the illiquidity risk premia, risk-adjusted returns may be improved.

Risk premia peaks in 2008 at 359, and has a low of zero in 2007.

Chart tracking holding period in years of specific asset classes
Source: Willis Towers Watson, April 2021
Many investors that hear illiquidity pursue the topic no further, given the inherent nature of spending requirements for some or restrictive investment guidelines. This would imply that a real assets allocation is not suitable due to asset class illiquidity. However, we believe this would mean ignoring one of the deepest opportunity sets for stable cash flows, generated by long-term contracted revenues.
For illustrative purposes only
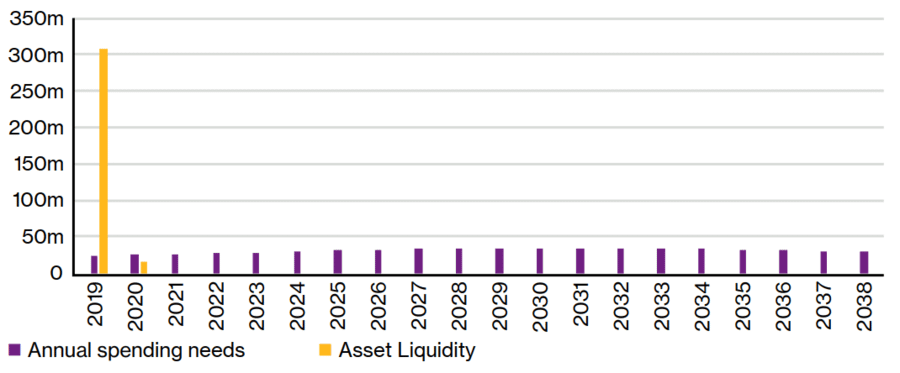
In 2019 benefit payments were $ 23.073 million and liquidity was at 307 million. In 2020 benefit payments were $24.445 million and liquidity was $16 million.
Source: Willis Towers Watson
Based on sample plan with liability duration of 14 and asset market value of $323m. The above reflects the general sentiment of Willis Towers Watson. Actual results may vary
Action: Asset owners should assess their annual spending needs relative to the liquidity profile of their assets. If 40% or more of their portfolio is liquid within one month, we believe asset owners should consider unlisted investing opportunities (given relative attractiveness). Additionally, those nearing their end state should re-evaluate positioning; we advocate asset owners hold real assets, which may include direct real assets, for as short of a time horizon as 18-24 months. Less than 18 months from major spending needs, an allocation to listed real assets may continue to be beneficial and aligned with termination objectives.
We advocate sponsors hold real assets, which may include direct real assets, for as short of a time horizon as 18-24 months.
02
Real asset constructs should include an array of strategies, spanning traditional and specialist mandates, and be inclusive of different liquidity terms and/or capital lock ups. These diversified allocations and vehicle types can offer varying contribution and redemption terms, while providing an expanded breadth of opportunities to deploy capital and source liquidity throughout time. For example, listed allocations can provide a liquidity buffer for immediate or unexpected cash needs and/or allow capital to be put to work quickly while waiting for contribution queues to be drawn down.
Leveraging a real assets multi-manager fund structure can facilitate crossing opportunities to more quickly extinguish queues, and/or may have capabilities to facilitate transactions in the secondary market to put capital to work more quickly. For example, one secondary transaction we completed on behalf of a US client in 2020, purchased desired units at an effective discount to NAV. This allowed us to increase exposure to a preferred manager with alternative property types, bypass the queue, and increase the overall contribution from income to total return.1
Action: Plan sponsors/asset owners should utilise the full array of both listed and unlisted opportunities within real assets, consistent with segment objectives and the role in the portfolio. Ongoing cash flow planning should be conducted to address sources of liquidity given timing and notification considerations, aided by stress testing the portfolio for liquidity events. This should be done at the real asset segment, as well as at the total portfolio level.
03
The real assets universe offers a wide array of sectors with different return drivers and risk factors. Traditional property types, defined as office, apartments, industrial and retail, are more economically sensitive and correlated with GDP growth, as leasing for these segments is predicated in part on low unemployment, housing demands and wage growth. Alternative property types, such as healthcare, senior and student housing, and social infrastructure are less economically sensitive given the “needs based” profile which generates higher levels of income. Lesser-known drivers of value are emerging which include essential technology and data infrastructure, life sciences, and renewables and energy efficiency, which take advantage of transformative trends which are generating structural growth opportunities.

Source: Willis Towers Watson, NYSE, NCREIF 2020
Predictable cash flows driven by essential goods or services, coupled with exposure to long-term secular trends, results in greater certainty of future returns versus those that are based off economic growth. This is further aided by greater downside risk protection, as the higher income component provides a floor to market drawdowns.
Action: Asset owners should review the range of their real asset exposures to return drivers, risk factors and economic sensitivities, looking beyond discrete labels such as real estate, infrastructure, US and global. By diversifying across themes and sectors, we believe sponsors will be able to increase the cash flow resiliency of the segment, and capture greater longer-term wealth accumulation independent of the market and economic environment.
04
Investing alongside peers within the ODCE universe is a fairly common approach among US pension plans. This is unsurprising given the total portfolio diversification benefits this unlisted allocation can provide, and also due to the range of investment managers which are included within the ODCE. However, this also introduces forced concentration among property types and regional exposure within your real asset portfolio.

Source: NCREIF 2020
The ODCE exposures have remained largely static over time and are representative of historical economic growth. We believe expanding the opportunity set not only reduces the concentration of sectors and future returns, but also increases the number of structural growth drivers and those that should benefit from continued and stable demand. This pivots your portfolio to forward-looking return generation, aligned with a transformational “new” economy. Anchoring towards past experiences and/or familiarity can result in missed opportunities to improve the risk-adjusted return contribution to your total portfolio.
Action: Diversify real asset portfolios beyond traditional sectors such as retail and office into those with greater structural tailwinds behind them. Consider utilising specialist managers less constrained by large existing generalist portfolios likely overweight the traditional sectors.
05
Given the expansive universe, not all offerings are equally “expensive” on an absolute basis. For example, we have worked with investment managers to create listed systematic alpha strategies available at highly competitive fees of less than 40 bps. These are available at a significantly lower cost than the average global institutional REIT offering of 75 bps*. Unlisted offerings, particularly those of traditional property types, typically range between 80-110 bps. Managers running specialised mandates or those that manage non-traditional or more niche strategies have a wider range of fees, which may span between 75-175 bps.* 2
While the above fee ranges are representative of standard or off-the-shelf fees, leveraging scale to negotiate, or seeding a new strategy can further reduce fees. This produces advantageous terms for the investor, including greater alignment of interests between managers and investors. This is the approach we take on behalf of our clients that use our real assets solutions, where manager fees for unlisted real asset funds vary between 40-90 bps.*
*Source: Willis Towers Watson, eVestment December 2020
Action: Considering fees in isolation while ignoring context will result in missed portfolio enhancement opportunities. When evaluating a new investment, avoid labeling opportunities as cheap or expensive without also contemplating the benefits and trade-offs that are necessary inputs to investment decisions. Specifically, target a higher return per unit of risk relative to expense (denominator) as a way of comparing the net impact a strategy can have.
There are a variety of reasons why asset owners may have hesitancy investing into real assets, but we believe that these can be overcome through a process of education and greater understanding. Well-constructed, diversified Real Asset portfolios can provide differentiated sources of return potential and should be considered by all asset owners even when their time horizons may be perceived as too short to consider real assets, given that illiquidity concerns are often not fully thought through.
The information included in this presentation is intended for general educational purposes only and does not take into consideration individual circumstances. Such information should not be relied upon without further review with your Willis Towers Watson consultant. The views expressed herein are as of the date given. Material developments may occur subsequent to this presentation rendering it incomplete and inaccurate. Willis Towers Watson assumes no obligation to advise you of any such developments or to update the presentation to reflect such developments. The information included in this presentation is not based on the particular investment situation or requirements of any specific trust, plan, fiduciary, plan participant or beneficiary, endowment, or any other fund; any examples or illustrations used in this presentation are hypothetical. As such, this presentation should not be relied upon for investment or other financial decisions, and no such decisions should be taken on the basis of its contents without seeking specific advice. Willis Towers Watson does not intend for anything in this presentation to constitute “investment advice” within the meaning of 29 C.F.R. § 2510.3-21 to any employee benefit plan subject to the Employee Retirement Income Security Act and/or section 4975 of the Internal Revenue Code.
Willis Towers Watson is not a law, accounting or tax firm and this presentation should not be construed as the provision of legal, accounting or tax services or advice. Some of the information included in this presentation might involve the application of law; accordingly, we strongly recommend that audience members consult with their legal counsel and other professional advisors as appropriate to ensure that they are properly advised concerning such matters. In preparing this material we have relied upon data supplied to us by third parties. While reasonable care has been taken to gauge the reliability of this data, we provide no guarantee as to the accuracy or completeness of this data and Willis Towers Watson and its affiliates and their respective directors, officers and employees accept no responsibility and will not be liable for any errors or misrepresentations in the data made by any third party.
This document may not be reproduced or distributed to any other party, whether in whole or in part, without Willis Towers Watson’s prior written permission, except as may be required by law. In the absence of its express written permission to the contrary, Willis Towers Watson and its affiliates and their respective directors, officers and employees accept no responsibility and will not be liable for any consequences howsoever arising from any use of or reliance on the contents of this document including any opinions expressed herein.
Views expressed by other Willis Towers Watson consultants or affiliates may differ from the information presented herein. Actual recommendations, investments or investment decisions made by Willis Towers Watson and its affiliates, whether for its own account or on behalf of others, may not necessarily reflect the views expressed herein. Investment decisions should always be made based on an investor’s specific financial needs.
Towers Watson Investment Services Hong Kong Limited is registered with the Securities and Futures Commission for Type 1 (Dealing in Securities) and Type 4 (Advising on Securities) regulated activities (CE No.: AON849). It is also registered with the Mandatory Provident Fund Schemes Authority as a Primary Intermediary. The contents of this document is prepared for Professional Investors only and have not been reviewed by any regulatory authority in Hong Kong. If you are in any doubt of the contents of this document, you should obtain independent professional advice.
1 This case study is an illustration of our capabilities provided to an individual client. Client results may vary and there can be no guarantee of similar results. It is not known whether the client approves or disapproves of TWIS or its advisory services
2 This is a sample representation of our work with investment managers. Outcomes will vary and there is no guarantee that we can achieve savings with any particular manager in any particular asset class. Reduced fees may be attributed to other factors besides TWIS’s buying power including asset allocations to lower fee asset classes or passive management.
| Title | File Type | File Size |
|---|---|---|
| Top five myths of investing in real assets | 3.8 MB |