Hail losses are relatively frequent in South Africa. Seven of the top 10 insured natural catastrophe events since the 1970s have been associated with hail, with upwards of 45% of the total value of insured motor and property claims from natural perils over that period caused by hail damage.
The frequency coupled with the potential for severe loss accumulations – as demonstrated by the catastrophic November 2013 losses in Pretoria – can threaten insurers’ earnings stability (i.e. their ability to pay dividends to their shareholders). Motor books are particularly susceptible to large hail claims. For many South African insurers, a violent hailstorm over Johannesburg’s N1 Western Bypass at peak rush-hour would probably be one of their worst nightmares, and since thunderstorms (which often produce hail) tend to develop in the afternoon and early evening in the summer inland, this is a very real possibility.
Faced with this kind of risk, a firm understanding of the potential financial impacts of a devastating 50-year hailstorm or the expected loss over the next 10 years in South Africa is critical.
Applications of hail catastrophe risk model outputs include:
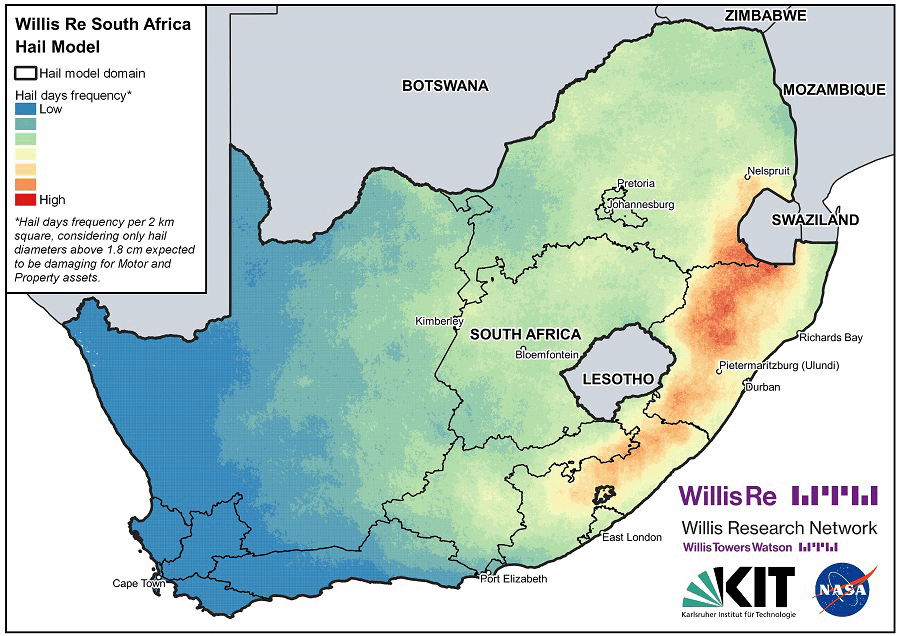
Such models have moved on in leaps and bounds in recent years as improved scientific understanding and modelling techniques have converged. As an example, Willis Re’s recently launched new Hail Catastrophe Risk Model that quantifies the risk from damaging hail events across South Africa, has involved an extensive, ongoing collaboration with Willis Research Network partners at the Karlsruhe Institute of Technology (KIT) in Germany and NASA’s Langley Research Centre, supported by the NASA Applied Science Disasters Program.
The model, which was launched in February 2021 as a greatly more sophisticated solution than its predecessor, features a comprehensive stochastic hail catalogue, developed by hail experts at KIT using EUMETSAT Meteosat Second Generation (MSG) geostationary satellite data between 2005 and 2018. After applying the latest NASA hail detection algorithms to the MSG data, KIT has been able to map the distribution of observed hail frequency and severity. Events and their attributes were then simulated for a 25,000-year period to generate an extensive catalogue of hail events, with their footprints and parameter distributions reflecting observations in South Africa.
The key to more sophisticated models is better detection.
Hail forms in intense updraft regions within thunderstorms. These rising updrafts create unique and detectable patterns called overshooting cloud tops (OTs) in satellite infrared cloud top temperature observations, collected every 15 minutes by sensors such as MSG’s Spinning Enhanced Visible and InfraRed Imager (SEVIRI). These detection methodologies are particularly important in regions where on-the-ground hail reports are limited, such as in South Africa. NASA is extensively applying these same OT-detection algorithms to generate reliable records of hail occurrences in satellite-imaged, hail-prone parts of the world, including North America and South America.
The limiting factor associated to this methodology is the length of available satellite imagery. In South Africa, the MSG SEVIRI infrared imager provides consistent observations back to 2005. But with 14 years of hail data, how can one be confident in assessing the risk from all potential hail occurrences and sizes?
This is where KIT’s stochastic simulation methodologies come in. By simulating the full range of plausible hail events, represented by modelling the characteristics of historical event distributions, they create a comprehensive catalogue, containing hundreds of thousands of individual simulated hail events. Simulated events can be described not only by their annual frequency of occurrence, but also contain important attributes including mean hail diameter and time of day of occurrence. In total, KIT defined nearly 235,000 hail events with diameters between approximately 2cm and 20cm that would have potential to cause damage to insured motor and property assets.
By comparing early iterations of the hazard event set generation with known claims locations, this provides confidence in characterising those areas with higher frequency of damaging hail.
One of the additional challenges with understanding hail risk to vehicles is day and night variability. As some commuters return home and park their cars in garages, and commercial fleets are stored in covered warehouses, the average susceptibility of those exposures to hail damage decreases. The ‘time-of-day’ of occurrence in KIT’s hail catalogue enables distinguishing between events occurring during the day and the night, and modelling of the average change in risk associated with daily mitigation practices.
The model also offers an innovative exposure disaggregation module, enabling clients to downscale their aggregated postcode exposures to a high-resolution modelling grid. Just under 4,000 four-digit postcodes are transformed to almost 400,000 individual exposure sites, each one characterised by the proportion of residential, commercial and industrial development.
To translate hail diameters into insured hail losses, we can apply representative damage functions for each of the key classes of motor and property business according to the relative damageability between residential, commercial or industrial assets. This can support informed reinsurance assessments based on loss estimates for an entire portfolio.
Even with these latest scientific technologies, the true test of any natural catastrophe model of course is how it corresponds to local market experience.
Assessing modelled losses for its proprietary industry exposure database against available market claims, Willis Re found its new view of South African hail risk to align encouragingly with key claims benchmarks. Further analysis of 56 “major” claims events between 2004 and 2019 showed promising corroboration with the view of risk at short return periods. For tail events, modelled losses compared reasonably and favourably with the SAM regulatory view of hail risk, providing an independent sense check where capital regulations require quantification of this component. This validation gives confidence in employing the new model for risk transfer advisory for clients in the region, and for continued collaboration with our WRN partners to find new ways to improve our quantification of extreme hail risk.
Geoff joined Willis Towers Watson in 2013, and works with the Willis Research Network stakeholders and academic partners to match business needs to the latest in scientific research, and derive tangible outputs for Willis Towers Watson to help advise its clients to advance their understanding of risk from weather and climate related hazards.
His background is in meteorology and climate science, having worked in forecasting for over a decade for the UK Met Office and Bermuda Weather Service, in all aspects of delivering forecast services from media broadcasting to delivering warnings and actionable guidance on extreme weather phenomena such as tropical cyclones and heavy rainfall leading to flooding.
He holds a BSc in Environmental Science from the University of East Anglia, and a Masters (with distinction) in Climate Change from University College London. He is also an active Fellow of the Royal Meteorological Society.